
How to Look Up Dane County Jail Population Data
The Dane County Sheriff's Office publishes a "Resident Population Demographics" index. The page lists daily reports by date, so you open a single day to read that day's population and demographic counts. This is the key official source for population content because it is date-indexed and sheriff-published. It is browsed by date rather than searched, with month headings and a link for each day.
Because the count changes all day, the daily report is more reliable than a one-time roster glance. The current residents roster has shown snapshot counts varying by crawl time, with examples around 745 to 791 entries in 2026. Use the dated demographic reports for any figure you plan to cite, and record the exact report date.
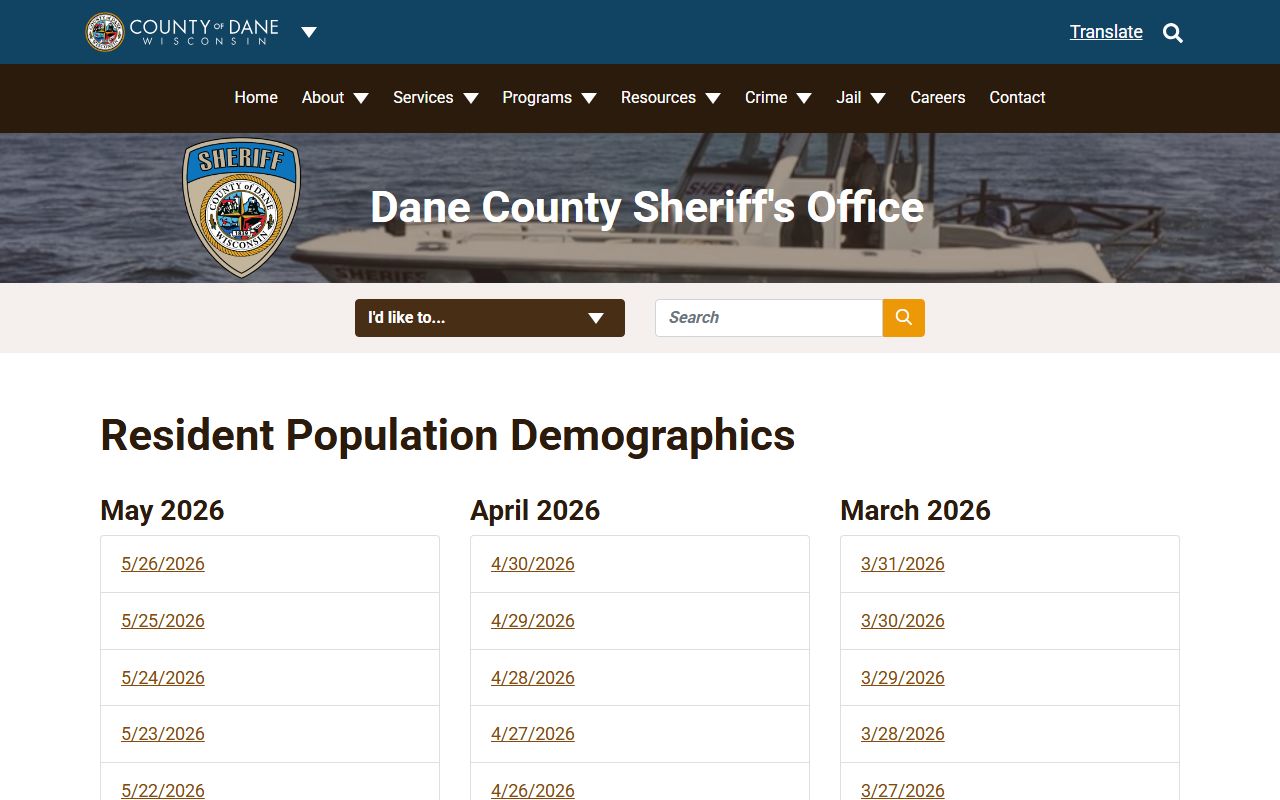
The resident population demographics index lists daily reports by month and date. Open a date to read that day's counts. The index has no search box. It is organized by month headings, with a link for each day, so you browse to the date you want rather than search for it. For a current figure, pick the most recent date; for a comparison, open the same day across different months.
Dane County Jail Capacity Overview
Dane County runs its jail out of two downtown buildings. The Public Safety Building and the City-County Building both house residents and keep separate visitation schedules, which confirms that custody is split by facility. The Sheriff has also been involved in a jail consolidation project, so housing arrangements can change over time.
| Facility | Address | Capacity |
|---|---|---|
| Public Safety Building Jail | 115 W Doty St, Madison, WI 53703 | Not published in inspected pages |
| City-County Building Jail | 210 Martin Luther King Jr. Blvd., Madison, WI 53703 | Not published in inspected pages |
Rated capacity by building was not listed on the official pages reviewed, so avoid quoting an old bed count. The current jail project and county budget documents are the right places to confirm capacity before relying on a number.
Average Daily Population
Average daily population is a measured figure, not a guess. It should be drawn from official daily reports or an official dashboard, not from a single roster snapshot. A roster count taken at noon can differ from one taken that evening, because bookings, releases, court transports, hospital transports, Huber movements, and transfers all move the number during the day.
To build a reliable average, gather several dated reports from the Sheriff's demographics index or use the Community Justice Council dashboard. Court schedules also affect daily counts. Initial appearances, bail hearings, sentencing calendars, weekends, and holiday closures all shift timing, so a holiday week can read differently from a normal one.
The cleanest way to report an average is to separate two ideas: the live roster count and the population analysis. The roster count is an operational number that changes hour by hour. The population analysis uses dated reports, so it smooths out the daily swings. When a number is meant to describe the jail over a month, the analysis figure is the honest one, and the report date should travel with it.
Demographic Breakdown
Each daily report can break the population into groups. Common dimensions include total residents, gender, race and ethnicity, age group, judicial status, and facility. Discussion of these numbers should stay close to the published labels. If race, age, sex, or legal status appear in an official report, cite the exact report date and the labels used, and avoid drawing conclusions the report itself does not draw.
| Dimension | What It Covers |
|---|---|
| Total residents | The full count for that report date. |
| Gender | The breakdown by sex. |
| Race and ethnicity | Group counts as labeled in the report. |
| Age group | Counts by age band. |
| Judicial status | Pretrial, sentenced, hold, writ, and similar labels. |
Note: Exact daily values were not extracted here, so open the dated report for precise numbers and labels before citing them.
Pretrial Versus Sentenced Population
The judicial status field is the best stand-in when a report does not publish a clean pretrial-versus-sentenced split. Pre-adjudication statuses such as CO Prearraignment and CO Pretrial mean the case is still pending. Post-sentence statuses such as Sentenced with Huber and Prob Sentence/Work Release mean a local jail term is being served. A P/P Violation hold is supervision-related and should not be counted as an ordinary new pretrial booking.
| Category | Status Labels |
|---|---|
| Pre-adjudication | CO Prearraignment, CO Pretrial |
| Sentenced | Sentenced with Huber, Prob Sentence/Work Release |
| Holds and writs | P/P Violation (Hold), State Resident Writ |
Pretrial supervision shapes these numbers. Dane County Pretrial Services monitors court-ordered bond conditions and can reduce unnecessary detention for suitable cases.
The Dane County Pretrial Services page explains how supervision can keep a suitable case out of jail while it is pending.
Misdemeanor Versus Felony Population
Jail residents are held on a mix of misdemeanor and felony matters, plus holds and writs. The jail population is not the same as the prison population. The county jail holds people pretrial, people serving local jail sentences, people with probation or parole holds, people awaiting transfer, and writ residents. State prisons hold people sentenced to state custody under the Department of Corrections.
The District Attorney's page on sentences explains the difference between a local jail term and a state prison sentence, and how good time and Huber work release affect a sentenced resident.
The DA sentences page covers jail, prison, good time, Huber, and home detention. A person sentenced to prison leaves the county jail count once transferred to the DOC.
Mental Health and Medical Population
Capacity and population are not the same thing. Capacity means rated or operational beds, while population means people in custody. A jail can sit under its rated capacity overall and still feel crowded in a specific unit, such as a gender unit, a medical unit, or a mental-health unit. That is why a single total can hide pressure in one part of the jail.
Treatment and medical needs add another layer. Some residents need behavioral health or medical housing, and those needs affect how the population is managed even when the headline count looks steady. Official dashboards and jail project reports are the right sources for any detail on medical or mental-health housing.
This is one reason Dane County has studied jail consolidation. Spreading residents across two older buildings makes classification harder, since a medical or mental-health unit in one building cannot simply borrow beds from the other. A total that looks comfortable on paper can still strain a single specialized unit, which is exactly the kind of pressure a raw count hides.
National and State Context
Dane County numbers make more sense next to state and national figures. The Bureau of Justice Statistics publishes national and state jail reports that give a rate per 100,000 residents and trends over time. The Vera Institute publishes county-level incarceration trends that can be used for comparison. When you pull a county figure next to a state or national figure, label clearly which number is county-specific and which is state or national.
| Measure | Source |
|---|---|
| Dane County jail counts | Sheriff daily reports and the county dashboard |
| State jail rate per 100,000 | Bureau of Justice Statistics reports |
| County comparison trends | Vera Institute incarceration trends |
This keeps a comparison honest. A county snapshot, a state rate, and a national rate are three different things, and mixing them without labels can mislead.
Population Trends Over Time
To see how the Dane County jail population moves over months or years, use a series of dated reports rather than one day. The Sheriff's demographics index holds daily reports going back through recent months, and the Community Justice Council hosts dashboards built for trend analysis. Together they support a year-by-year view that a single roster cannot give.
Jail diversion and pretrial supervision are part of any trend story. Programs that supervise suitable cases in the community, along with Huber and home detention for sentenced residents, all affect whether a person is physically housed for every hour of a stay. Those programs can shift a trend without any change in arrests.
Read trends with care. A drop in the count can mean fewer bookings, faster case processing, more diversion, or a change in how a status is recorded. A rise can mean the reverse. The dated reports and the Community Justice Council dashboard let you check the labels behind a change, rather than guessing at a cause from a single number.
Searching for Dane County Inmate Records by Name
This page covers population data, not individual lookups. To find one person in custody, use the Sheriff's current resident roster instead, which searches by name and links to a booking detail. Population reports are aggregate and dated, so they are not the tool for confirming whether a specific person is held today.
For a name search and the full set of roster fields, see the Dane County inmate records page. For release confirmation, the released inmates page covers VINE and the state and federal locators.
Where the Data Comes From
Two official sources anchor Dane County jail population data. The Sheriff's demographics index gives the dated daily reports, and the Community Justice Council provides the dashboards and trend tools. The Community Justice Council is the county body that hosts jail population data for the public.
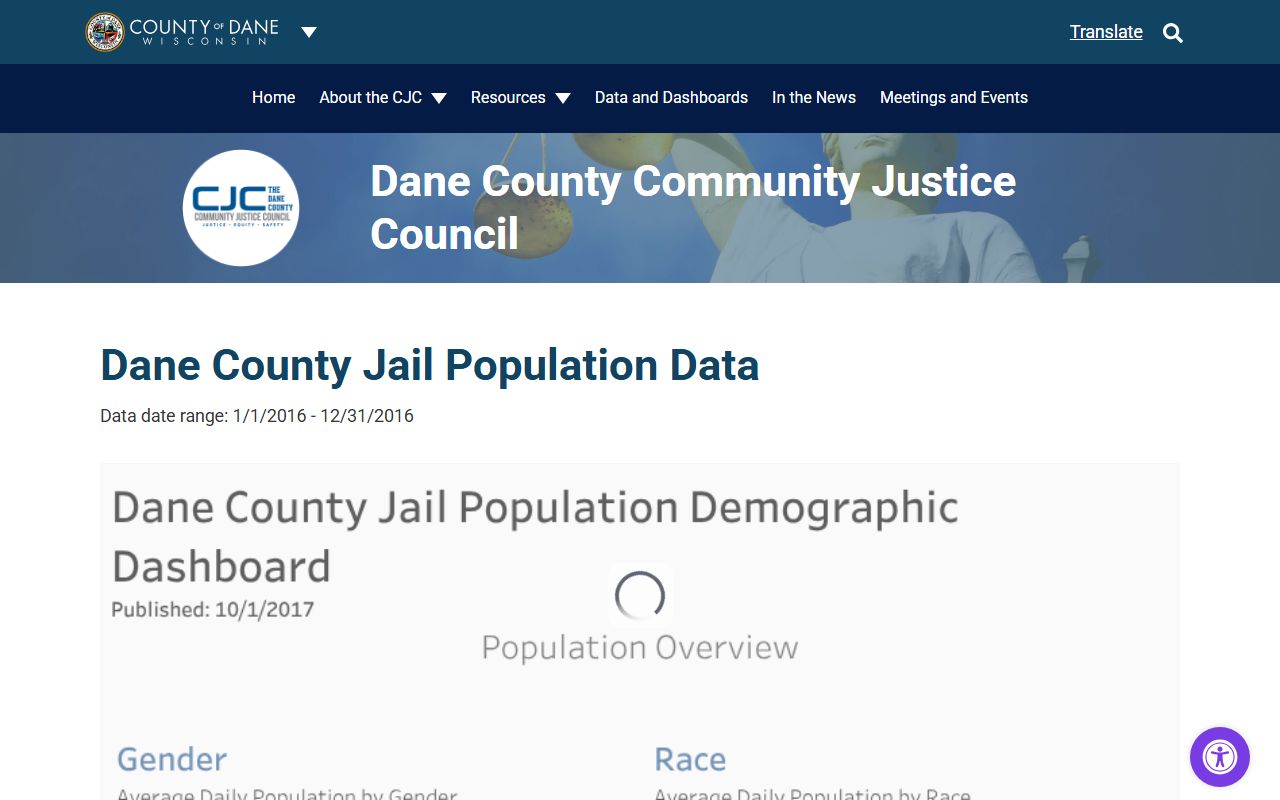
The Community Justice Council jail population dashboard is the county's home for trend reports. Pair it with the Sheriff's daily index for both point-in-time and long-term views.